
Open the full recorded screenshot ↗
An AI survey summary can give you the right number and still lead you toward a decision the data cannot support. Before acting, check which answers were counted, which were missing, and where the wording moves from arithmetic to interpretation.
Google announced Actionable Insights in Forms on November 5, 2026. It analyzes responses across questions and suggests takeaways. On November 9 we used the actual Forms interface to enter twelve fictional submissions, generate one set of actionable insights and compare it with a separate local count.
1. Check access before planning around the feature
The announcement describes an eligible Workspace or Google AI plan and a gradual rollout: Rapid Release began November 2, with up to fifteen days for visibility; Scheduled Release was due to start November 19. Our account had the feature on November 9. That observation does not establish access for another account or plan.
The English Forms Help page, read on the test date, specified at least twelve responses and three questions, quiz settings off, and access to the linked response Sheet. When we selected Generate actionable insights, Forms required linking the responses to a Google Sheet before generation. Use the current official eligibility list and the actual control in your account; a missing button is not proof that your data is wrong.
2. Give yourself a small reference you can count
We created a separate test form with three questions: working context (Solo or Team), improvements (a checkbox question allowing several choices), and an optional comment. We entered all twelve rows ourselves. Six were labelled Solo and six Team; one row skipped the checkbox question and another left its comment blank. No respondent emails were collected, no real customer responses were used, and the form was closed to further submissions after the run.
The fixed source JSON records every choice with row IDs R01–R12. For example, R01 selects both Clear steps and Reusable files; R06 selects neither; R12 selects Clear steps but leaves the comment blank. Keeping those distinctions makes it possible to check the narrative independently.
| Choice | Selections | Of 11 answered rows | Of all 12 rows |
|---|---|---|---|
| Clear steps | 8 | 72.7% | 66.7% |
| Reusable files | 7 | 63.6% | 58.3% |
| Video walkthrough | 3 | 27.3% | 25.0% |
There are eighteen selections from eleven answered rows. Because choices overlap, percentages of respondents need not add to 100%. Both percentage columns above are arithmetically valid; they answer different questions. A summary needs to say which denominator it uses.
3. Separate what the output got right from what needs judgment
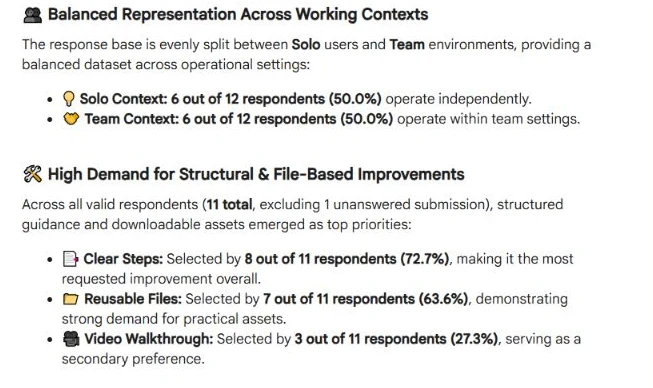
Forms' ordinary response chart showed 12 answers to the context question and 11 to the checkbox question. The generated insight also stated “11 total, excluding 1 unanswered submission,” then reported 8/11 (72.7%), 7/11 (63.6%) and 3/11 (27.3%). Those three counts and percentages matched our reference.
Its subgroup breakdown used five valid Solo checkbox answers and six Team answers. The Clear steps comparison was 4/5 (80.0%) versus 4/6 (66.7%). These were also correct for the supplied rows. Counting all six Solo rows instead would answer a different question and hide the skipped answer.
“Reusable Files: Selected by 7 out of 11 respondents (63.6%), demonstrating strong demand for practical assets.”
That is a quotation from the observed output, available in the displayed narrative transcript. The count is supported. “Strong demand” is an interpretation that should not become a market claim: we chose every fictional answer. Even an actual small convenience sample would need context before generalizing to a customer population.
The output grouped comments around written guidance, downloadable resources and short videos. The comments contain those topics, but the generated text did not provide a per-comment coding table. We did not treat the theme wording as an audited topic-frequency measurement. Nor does a higher percentage in one tiny subgroup show that working context caused a preference.
4. Reuse the review, not the fictional business conclusion
- Freeze a permitted source snapshot. Record the export date, question wording and whether multiple selections are allowed. Keep test rows separate from real results.
- Count before reading the narrative. Record total submissions, valid answers per question, blanks and subgroup counts. A linked Sheet or a local calculation can provide a separate check.
- Ask what each percentage means. Check its numerator and denominator. Do not change between all submissions and answered rows without saying so.
- Label interpretation and proposed action. A theme is not automatically a measured count; a suggested next step is not a commitment or proof of demand.
- Choose a proportionate next check. For real feedback, inspect the relevant answers or ask a specific follow-up before changing a product or spending money.
Our downloadable Python script calculates this JSON fixture without network access. It checks two valid structured claims and rejects four deliberately invalid controls: a mismatched denominator, a missing denominator, an inflated count and a claim that the fictional data proves population demand. It does not automatically understand or fact-check arbitrary AI prose.
Take the input, result and blank review sheet
Independent counts · Observed Forms narrative · Local Python script · Six bounded claim checks
python survey_summary_check.py --input fictional-responses.json --out reviewed-counts
What this run establishes
This was one Actionable Insights generation in an existing signed-in account, plus Forms' automatic text-response summary. The model version and per-generation cost were not exposed in the inspected UI. We did not create a subscription or purchase access. This is not a claim that every account can use the feature free of charge.
We checked the named counts against twelve controlled English-language rows. We did not test repeated runs, large datasets, multilingual feedback, runtime speed, real customer demand or time saved. The interface and eligibility can change; the announcement date and our observation date are separate. Use the files to practice reviewing a summary, then apply the checklist to material you are allowed to process.
For another everyday task, try the source-linked meeting-action workflow, or browse all AI workflows.